To visualize and analyze rankings, trends, or proportions of items in your records, you can use bar charts in Ragic reports. For example, you can compare sales data, track quarterly sales trends, or examine the proportion of each department’s expenses relative to the total.
After creating the bar chart report the following page will appear. The settings for the bar chart are explained below:
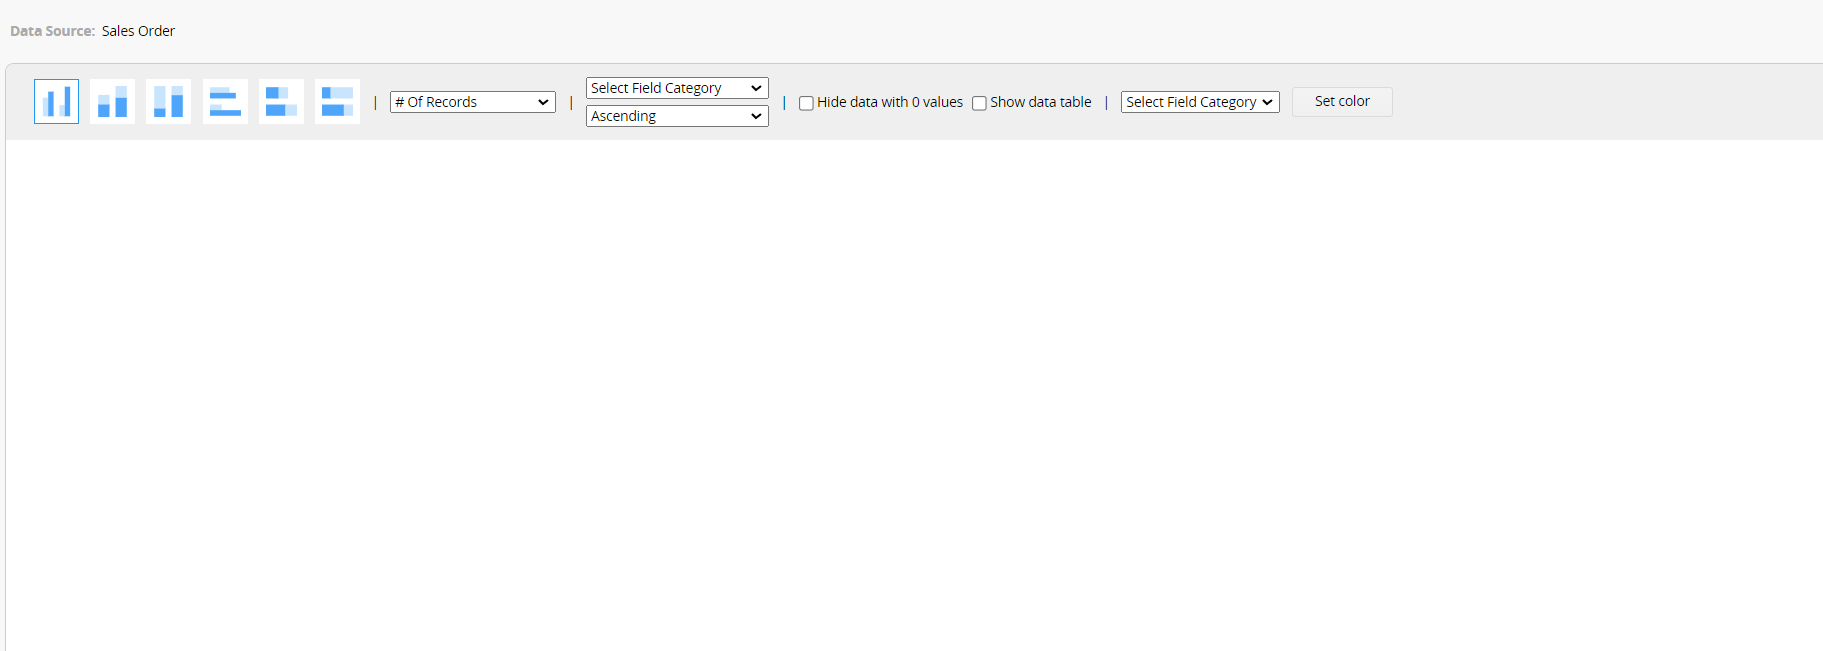
At the top left, select the type of bar chart. Currently, there are three types available, which can be presented in either "Vertical" or "Horizontal" format:
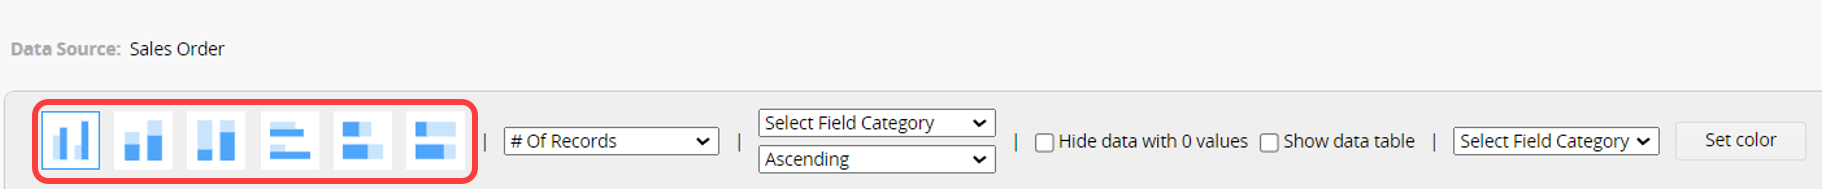
(1) Clustered Bar Chart: Used for comparing data across multiple categories.
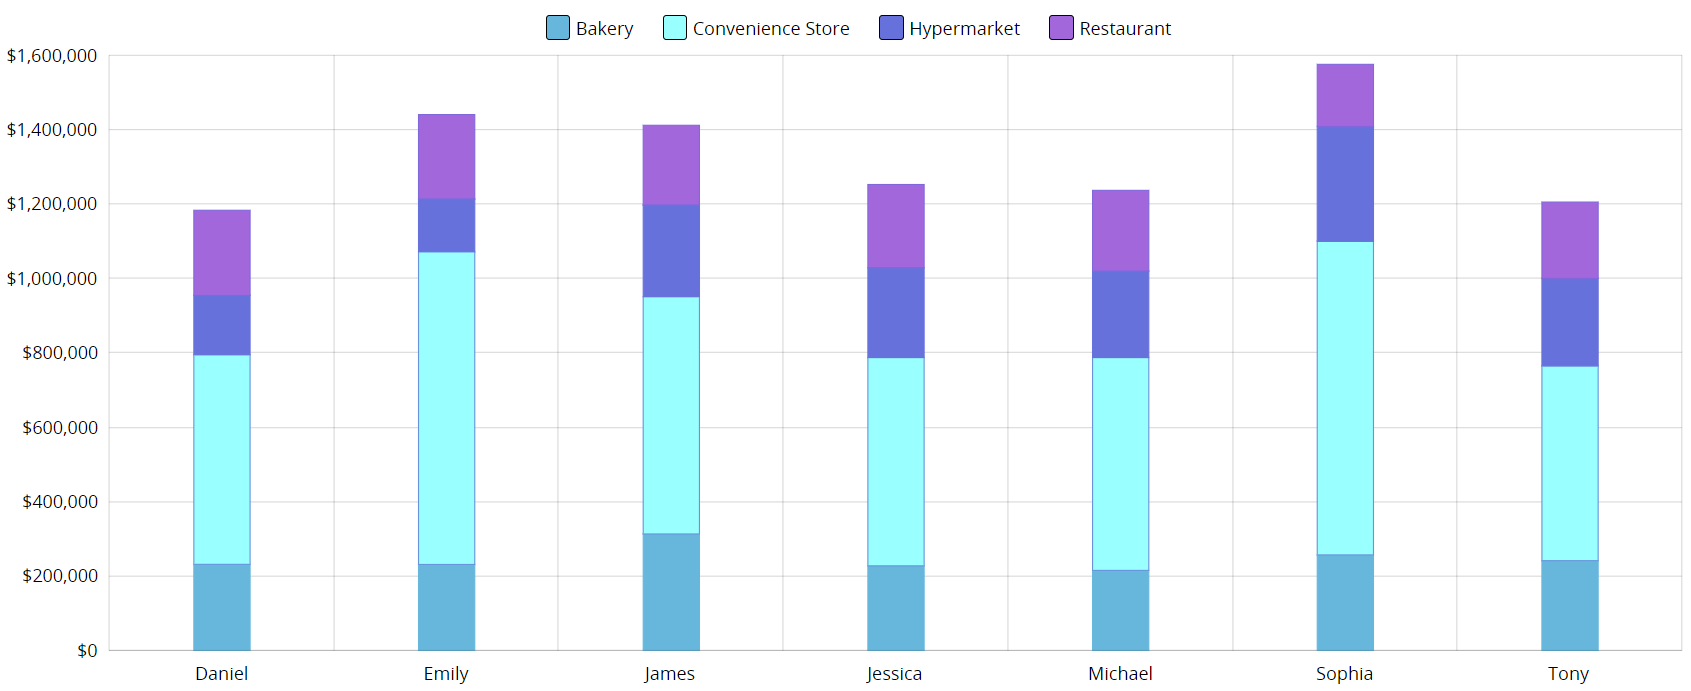
(2) Stacked Bar Chart: Used for comparing parts of a whole.
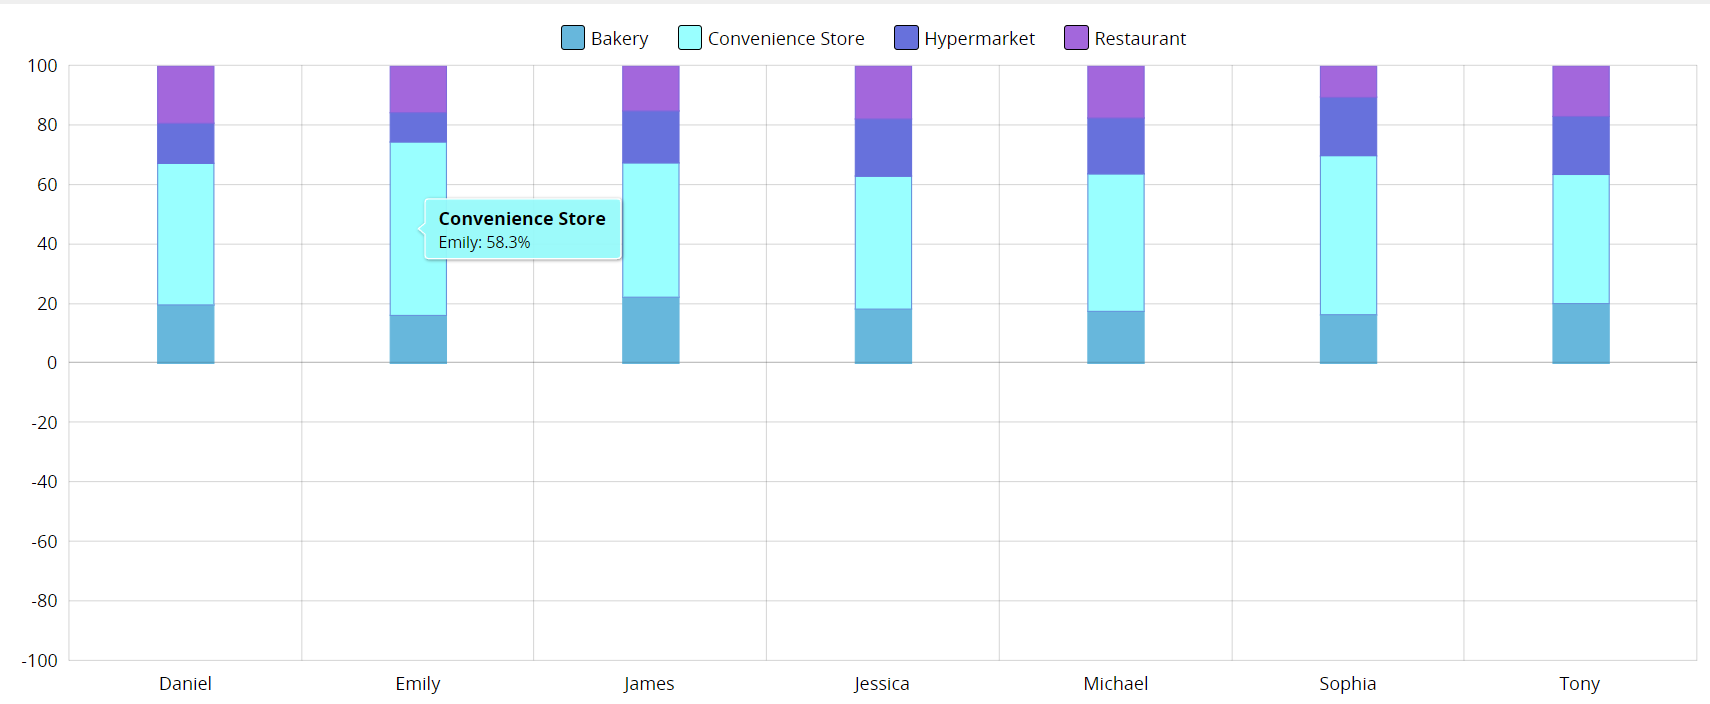
(3) 100% Stacked Bar Chart: Used for comparing the percentage each data contributes to the total.
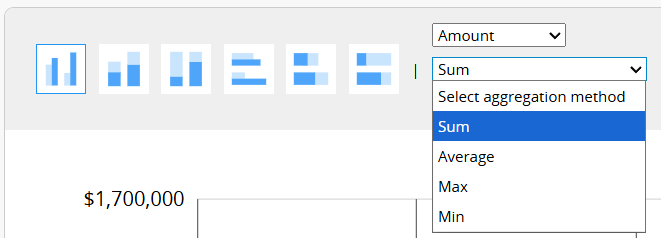
You can select the # of records or Numeric/Money fields from the sheet and determine the sorting order.

If you select a Numeric/Money field, you can set the aggregation method to "Sum", "Average", "Maximum", or "Minimum".
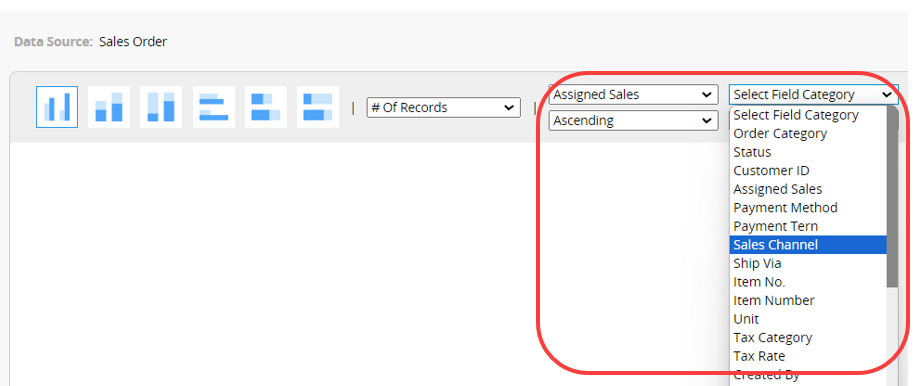
Select the "Primary Category" and "Secondary Category" fields, as well as the sorting method for each category.
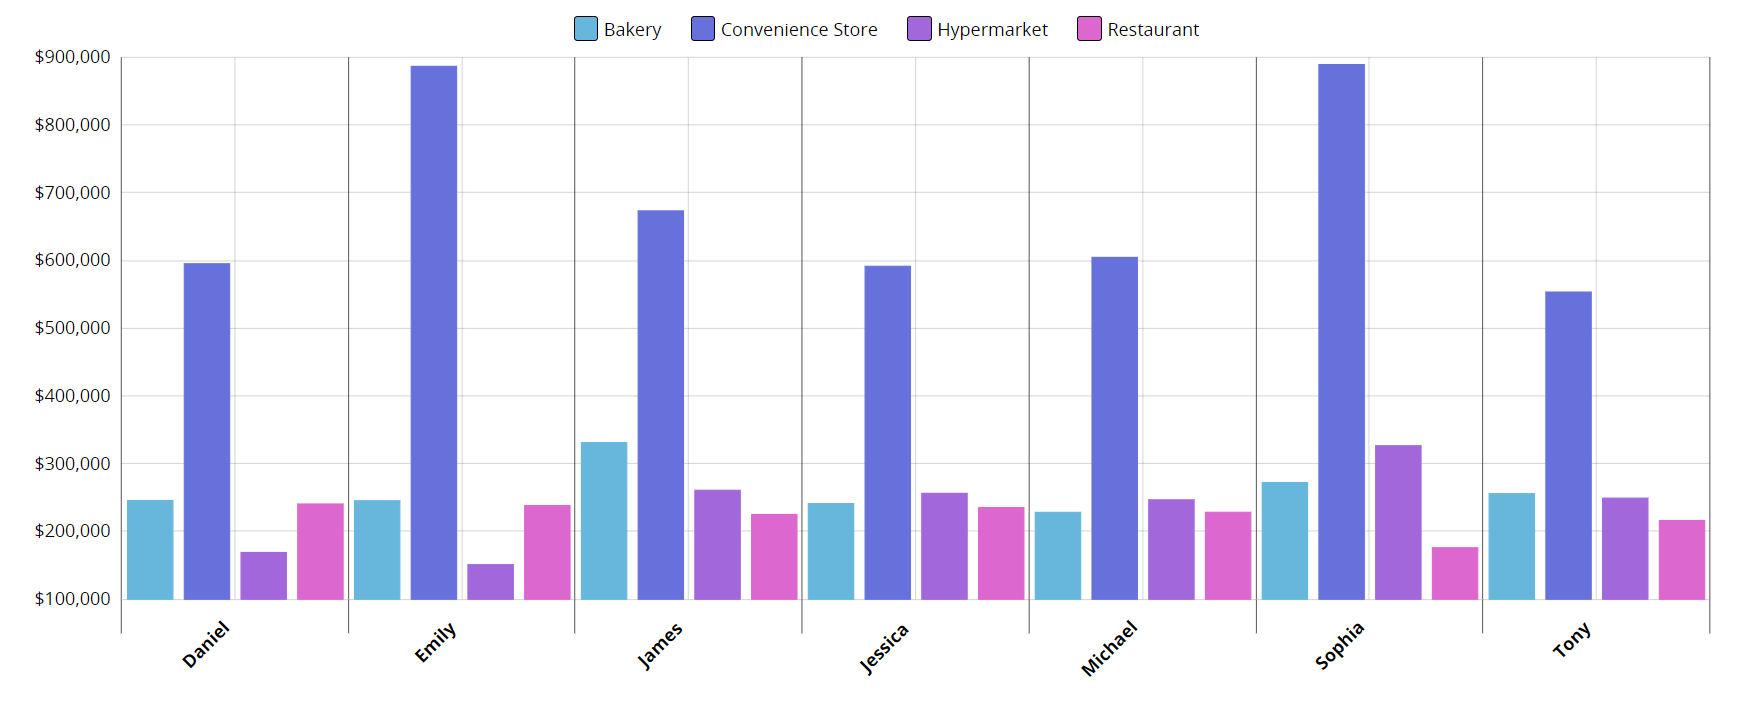
After selecting the two category fields, the bar chart report will be displayed below. Hover over the bar chart to view the actual values or percentages for each item.
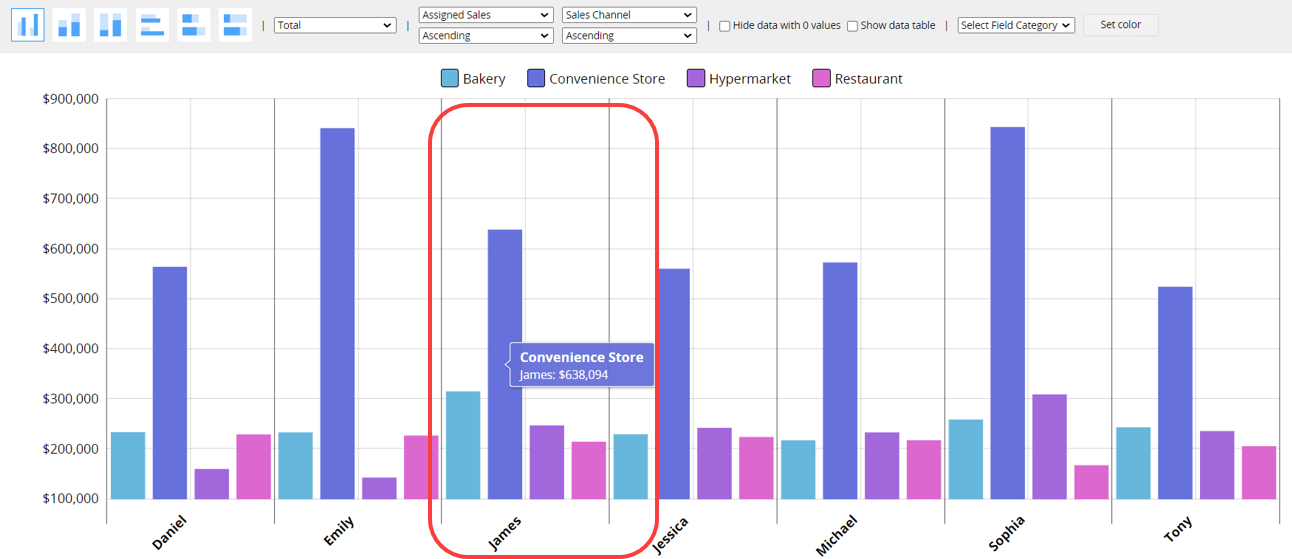
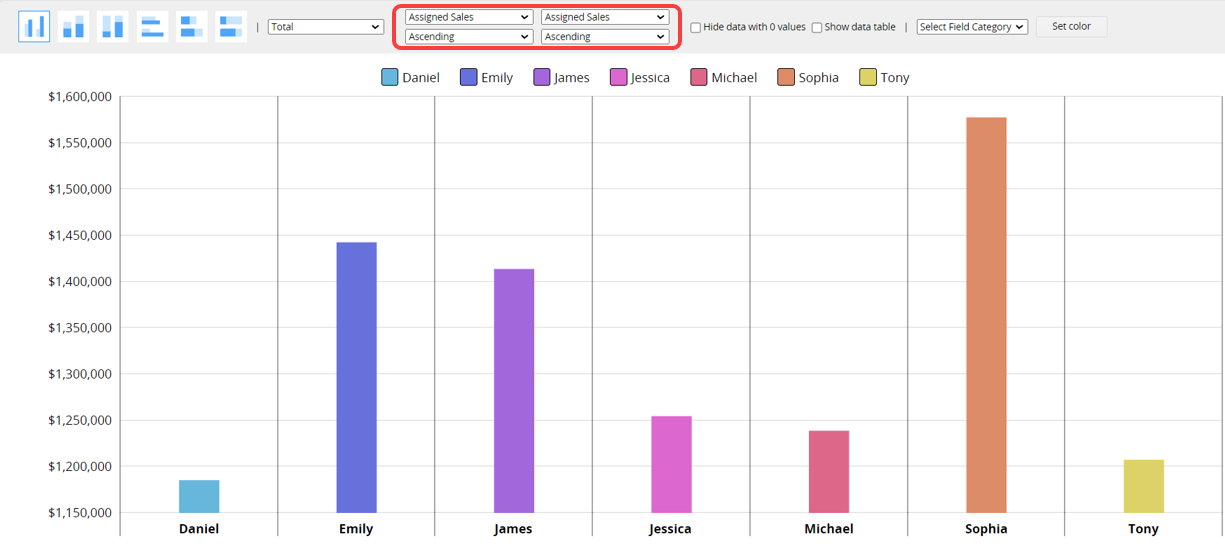
If you wish to analyze only one field, you can select the same field for both category fields.
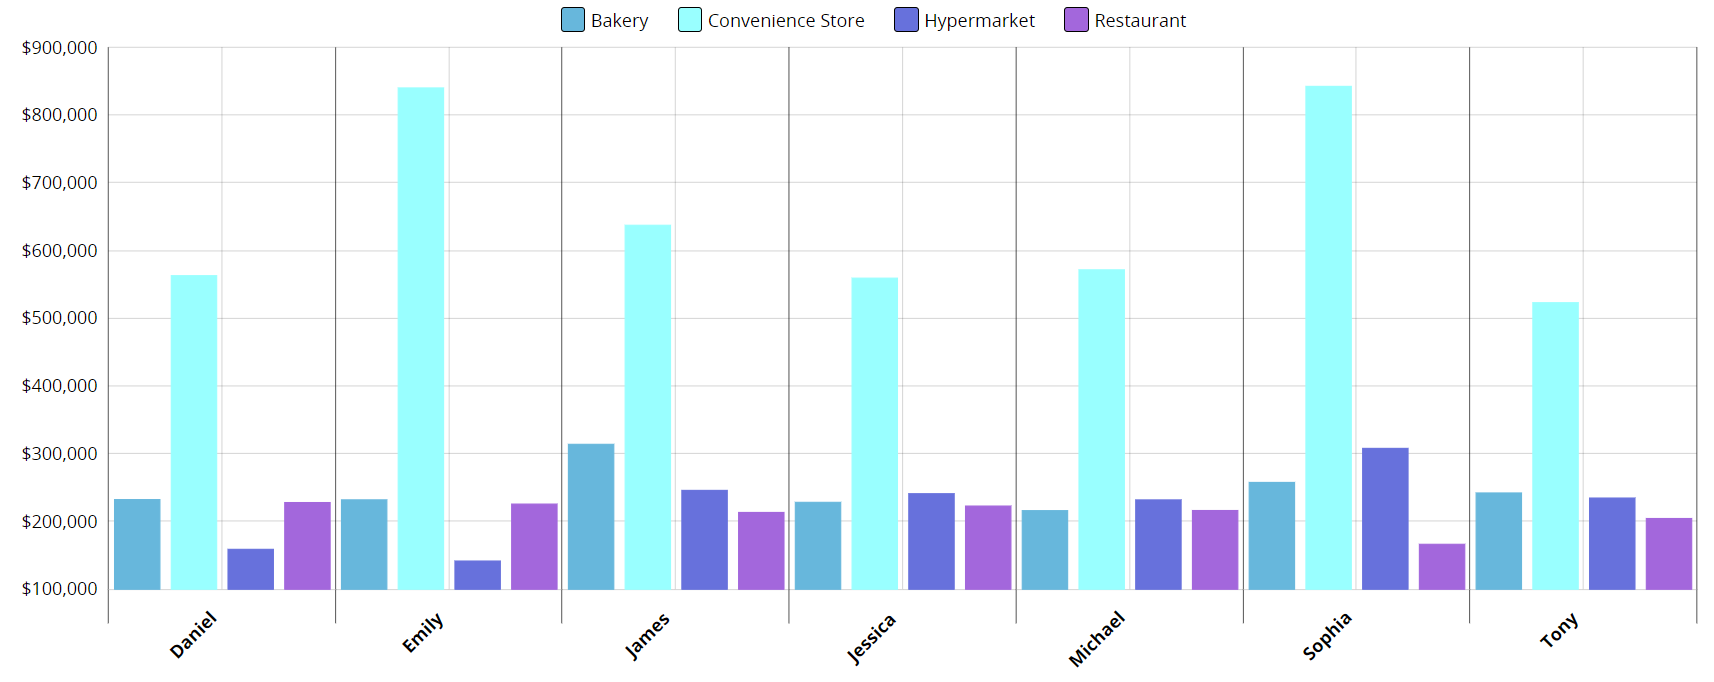
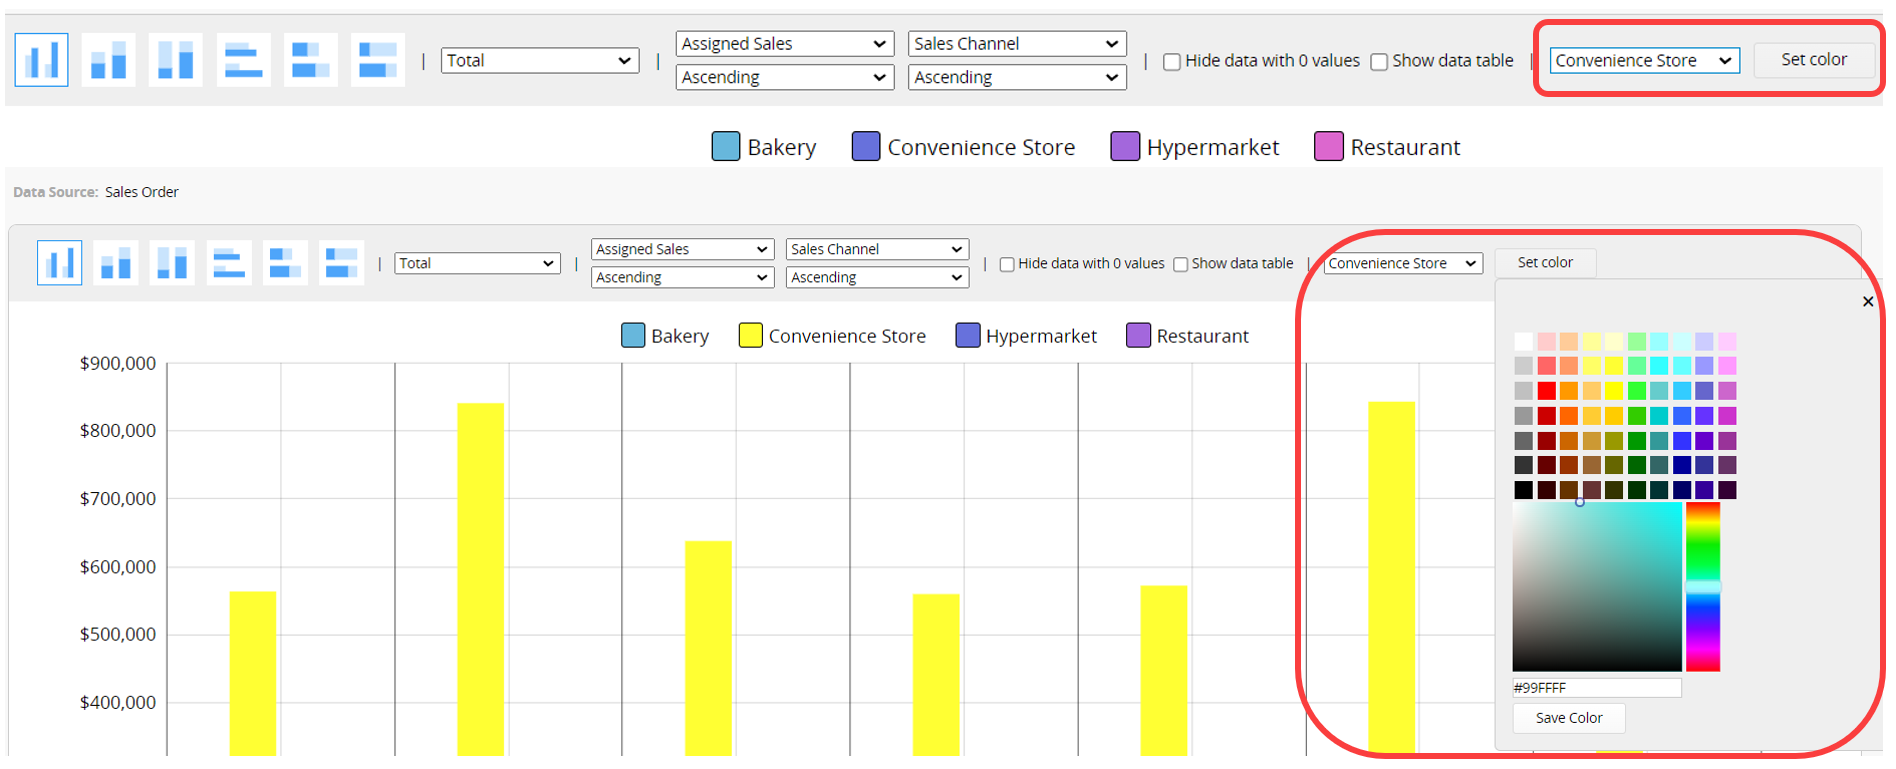
Choose the item from the "Secondary Category" field, and then you can customize the bar chart colors for it.
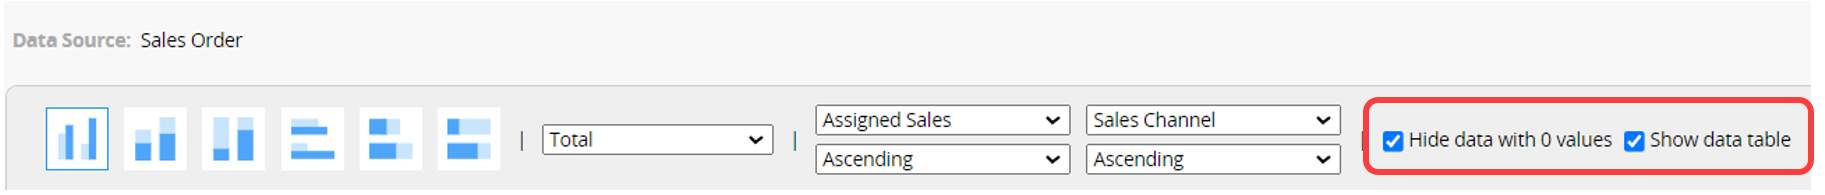
(1) Hide data with 0 values: Check this option to hide data with zero values.
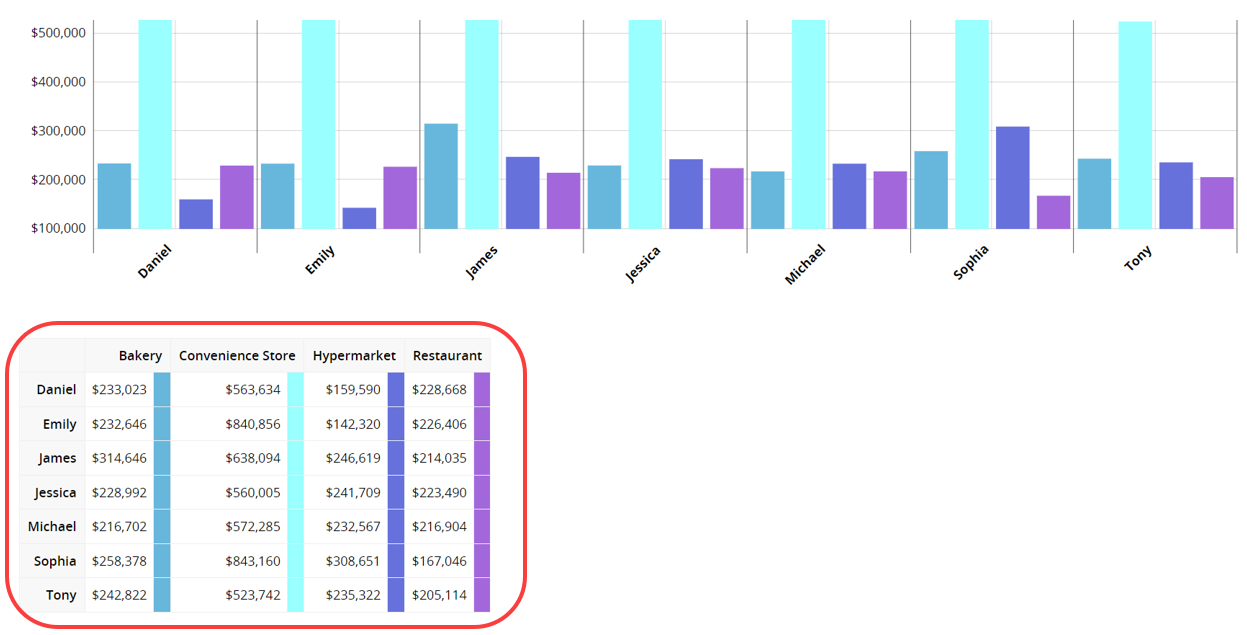
(2) Show data table: Check this option to display a table below with the actual values or percentages from the sheet.
If you frequently use this type of report, you can save it for easy access later. Additionally, you can export the report as a PDF file or print it.
You can apply filters to generate the desired report.
You can embed the report into your website or share a link with others.
In the Report Settings, you can adjust the report’s style settings, including font, font size, borders, etc., and the report’s Filter and Access Rights.
You can generate an editable Report Snapshot to highlight data, apply styles to report content (for example, bold, underline, or font color), add explanatory text, or remove unnecessary data without using filters.
 Thank you for your valuable feedback!
