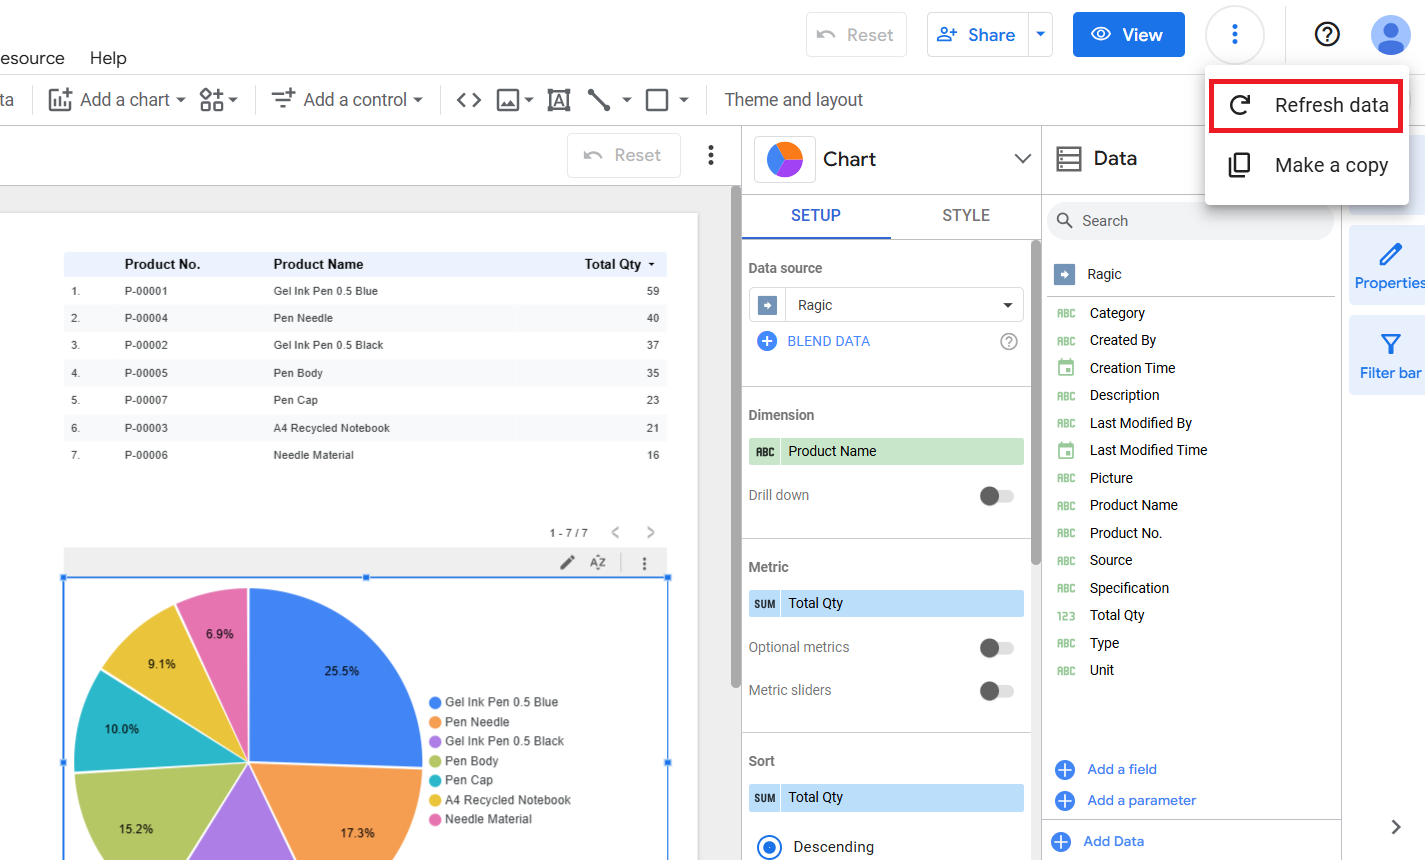
Google Looker Studio is a free cloud-based reporting and visualization tool provided by Google. Its main features include:
Note: It is currently not supported in the On-premises Private Server.
Search for the Ragic Connector
You can directly search for “Ragic” in Looker Studio’s CONNECT TO DATA section; or in an existing report, click “Add Data”, search for, and select Ragic.
Authorization
On first use, you will be directed to Google OAuth; once you grant permission, data can be retrieved.
Connector Settings and Linking
API Key: Please enter your Ragic API Key as the credential for database access.
Note: If you need a fixed identity to obtain an API Key, you can create a Service Account to generate a dedicated API Key.
Form URL: Please enter the form URL in the format: https://{domain}/{db}/{path}/{index}. (the form URL from “https” up to the character before the “?”)
Max Return Record: Default is 1000 records, but you can customize the maximum number of returned records.
Show Masked Data: Toggle whether to display masked text fields; actual display depends on API Key permissions.
Ignore Fixed Filter: Choose whether to ignore the form’s fixed filters (SYSAdmin permission required).
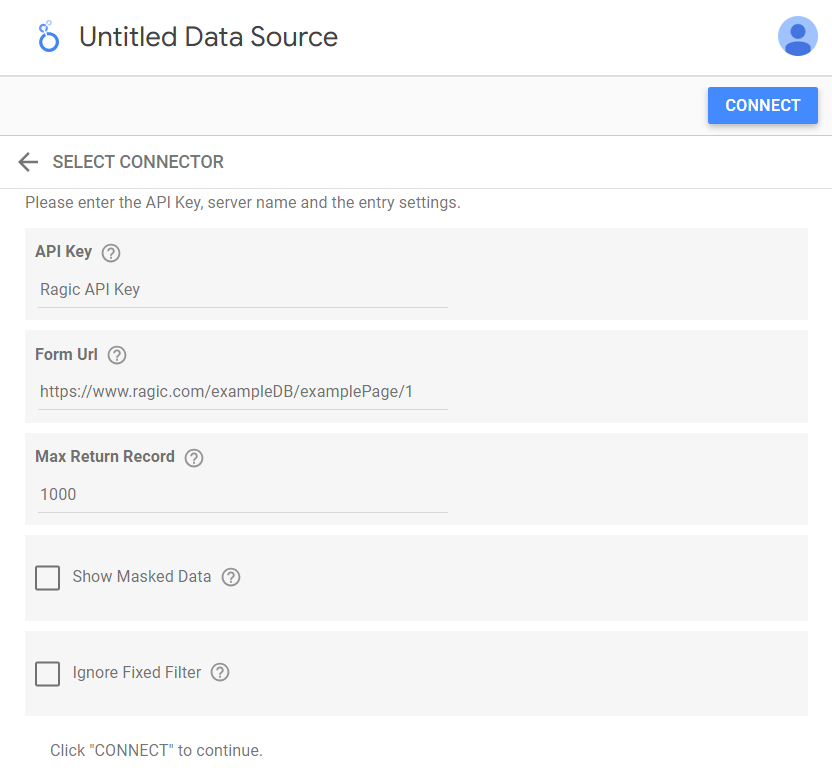
Once settings are complete, click “CONNECT” at the top right (or click “Add” in an existing report).
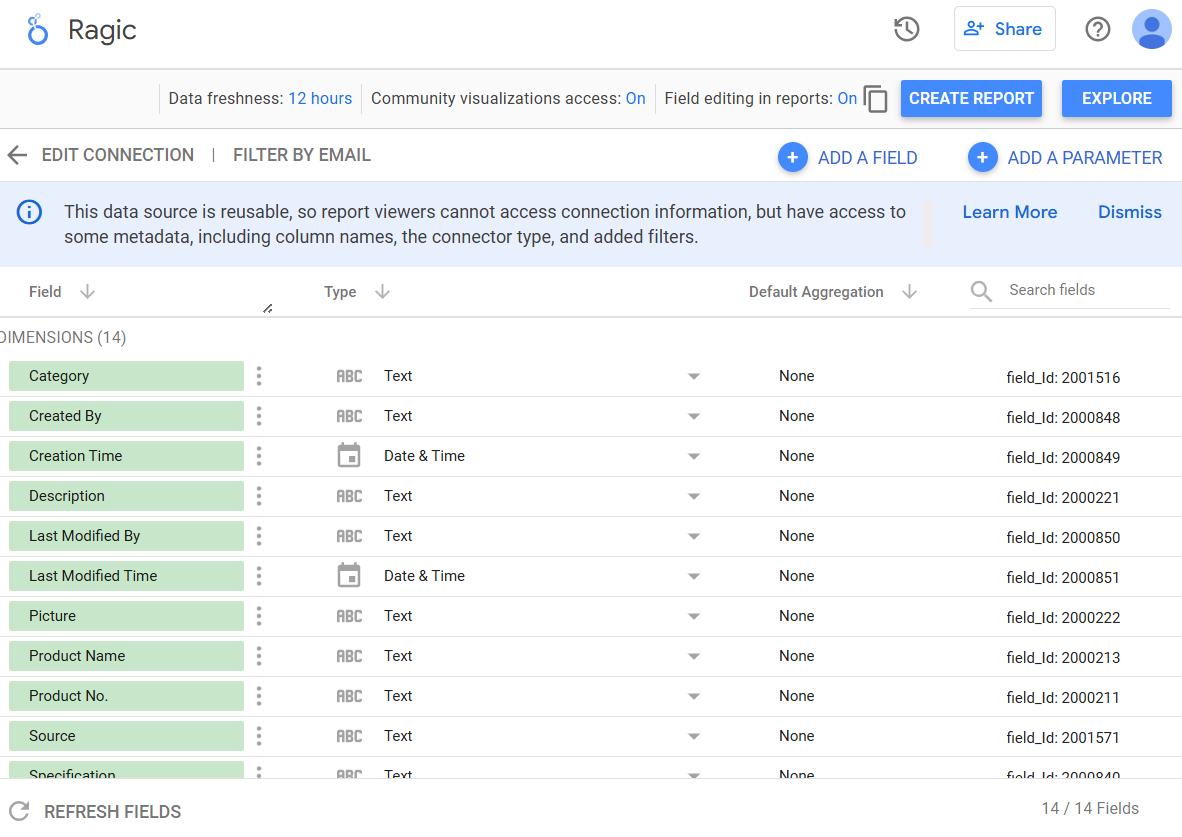
Configure Fields and Build the Report
After connecting, you will enter the field configuration page, where you can add, modify, or remove fields. When finished, click “CREATE REPORT”.
 Thank you for your valuable feedback!
