Coworkers can't get behind your current CRM software? Let us help you troubleshoot what isn't working so you can get everyone on board. Continue Reading
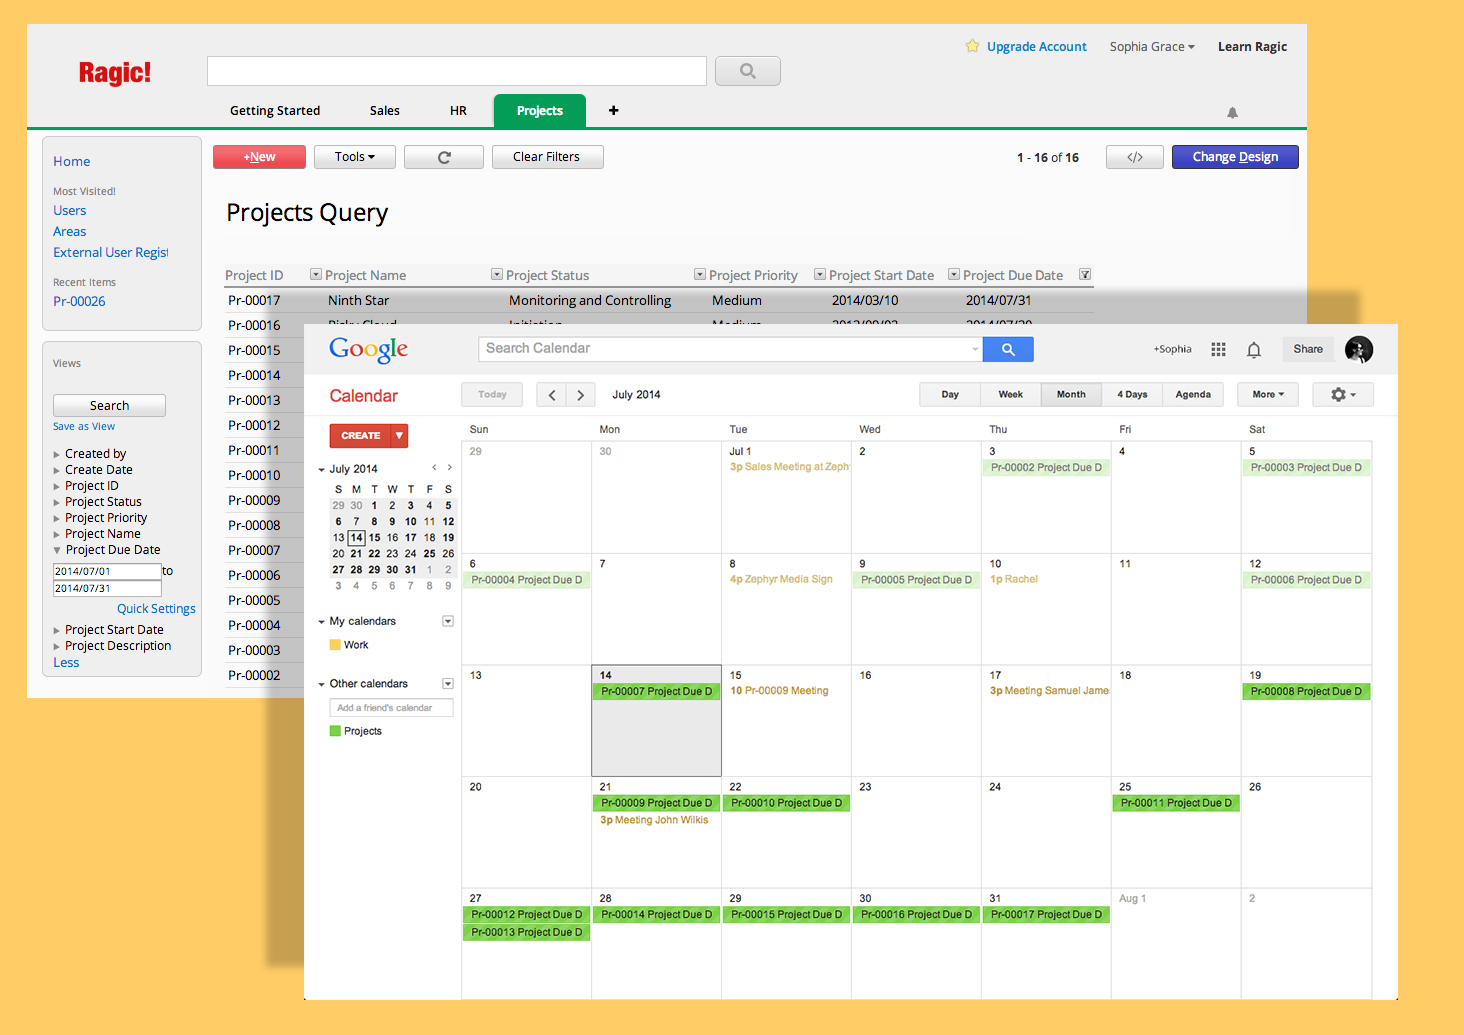
Calendar integration has been one of the most anticipated features on Ragic, and we are proud to say that it's finally here! Read on to learn how to add date fields from your Ragic database sheets to your favorite calendar app. Continue Reading
Whether you are an entrepreneur catching up on your reading, or an SMB owner struggling to keep up with emails, explore our list of free lifehacking tools that will help you to get your reading and writing done faster. Continue Reading
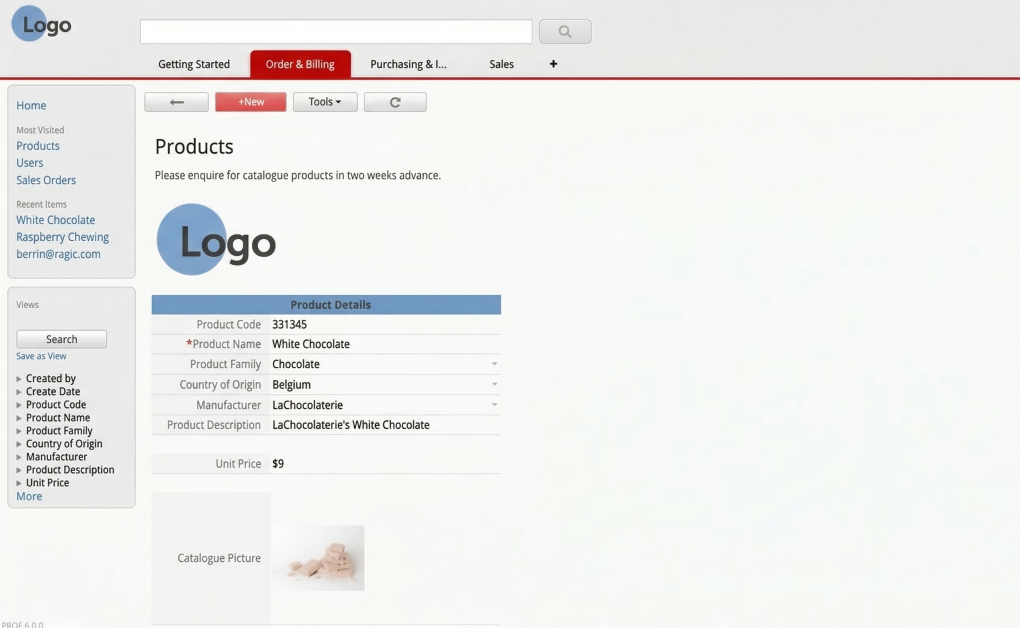
Ragic can help you customize your database sheets to match your desired look & feel. These tips will show you how to design your sheets like a pro! Continue Reading
We've just made document management on Ragic easier with our new application RagicDocs. The only thing you'll have to do is to link one of your Dropbox folders to your RagicDocs sheet, and you're good to go. Continue Reading
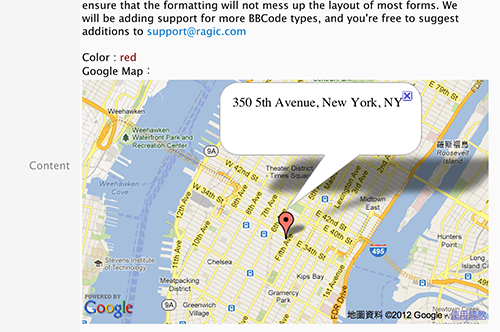
If you use Wordpress and want to embed your forms or listing pages from your database, you're in luck! A Ragic shortcode plugin is now available on Wordpress.org. Continue Reading
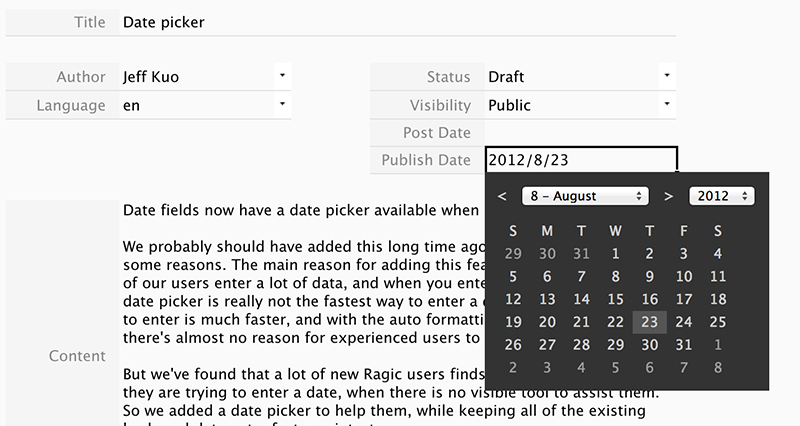
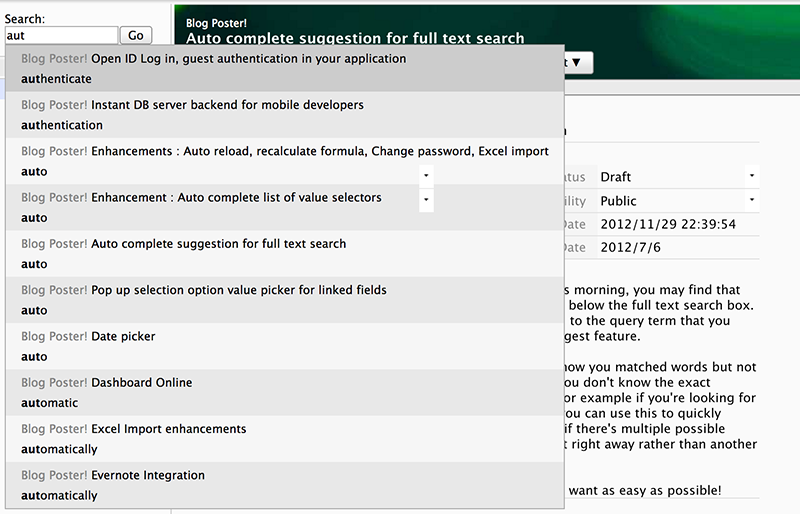
Keyboard entry is the quickest method for entering massive amounts of data, but we discovered many new users struggle entering dates without a visible date picker— we heard you and made this update available for everyone, while the keeping keyboard method entry intact Continue Reading
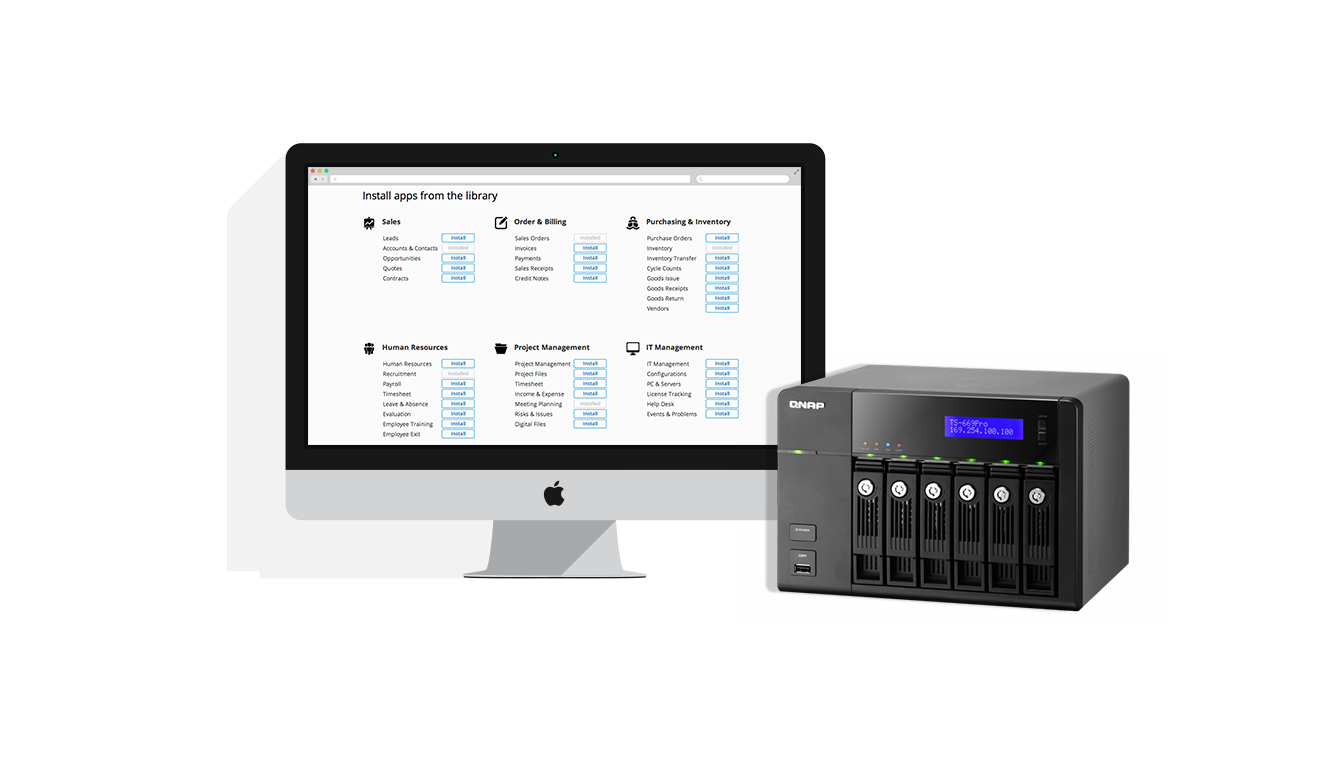
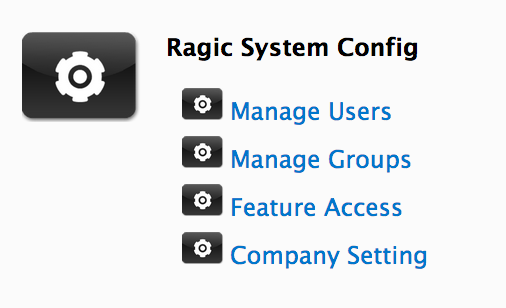
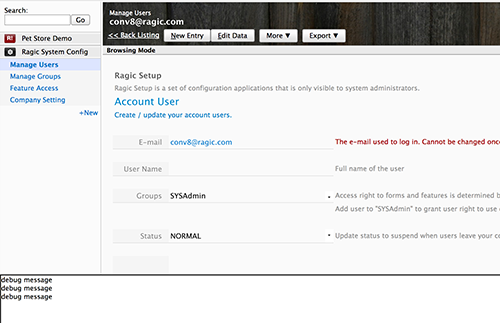
Ragic's new setup application can help you manage users and user groups, configure account privileges, and control feature access settings Continue Reading
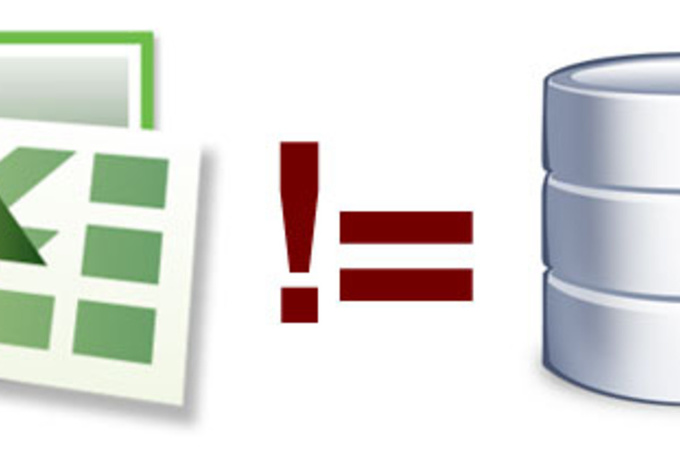
Excel is the world's most popular data management tool. But it gets ugly really fast because Excel is not designed for data management. Ragic makes building powerful online databases as simple as Excel.
Take a test drive